#
Data Browser
%20(1).png)
#
Run Result Panel
After running Elasticsearch query, the running result will display on a result panel, result panel include: left, middle and right panels.
#
Execution Details
Execution details display time usage for query
#
Data Panel
Display the query result data, support 3 mode: table mode, json mode and plot mode:
- table mode will flatten Elasticsearch source data to row and remove noise data
- json mode will display whole query result as foldable json data
- plot mode will display query data by vega-lite format
#
Explain&Profile Panel
Display the query explain and profile info when a run query with "explain": true, "profile": true
#
Table Mode
Elasticsearch most of the data can be displayed as table mode includes: source hits, aggregation response, mapping and templates, etcs.
#
Documents
Elasticsearch source hits documents default will display as table view and will remove noise info: shards, time etc.
#
Aggregations
Aggregation result always includes a nest object, it's hard to display and view, but EDQL has achieved flatten nested object to table view. So we can quickly and easily view the aggregate result.
#
Mappings
Index mapping in Elasticsearch designs its nest object json. But usually we just want to focus on a field type and name.
#
Features
- Search
- Add
- Edit
- Delete
- Commit
- Fields Filter
- Fit Pane
#
JSON Mode
In sometime some data it's hard to display table directly, In these scenarios the query response will directly display as JSON
#
Plot Mode
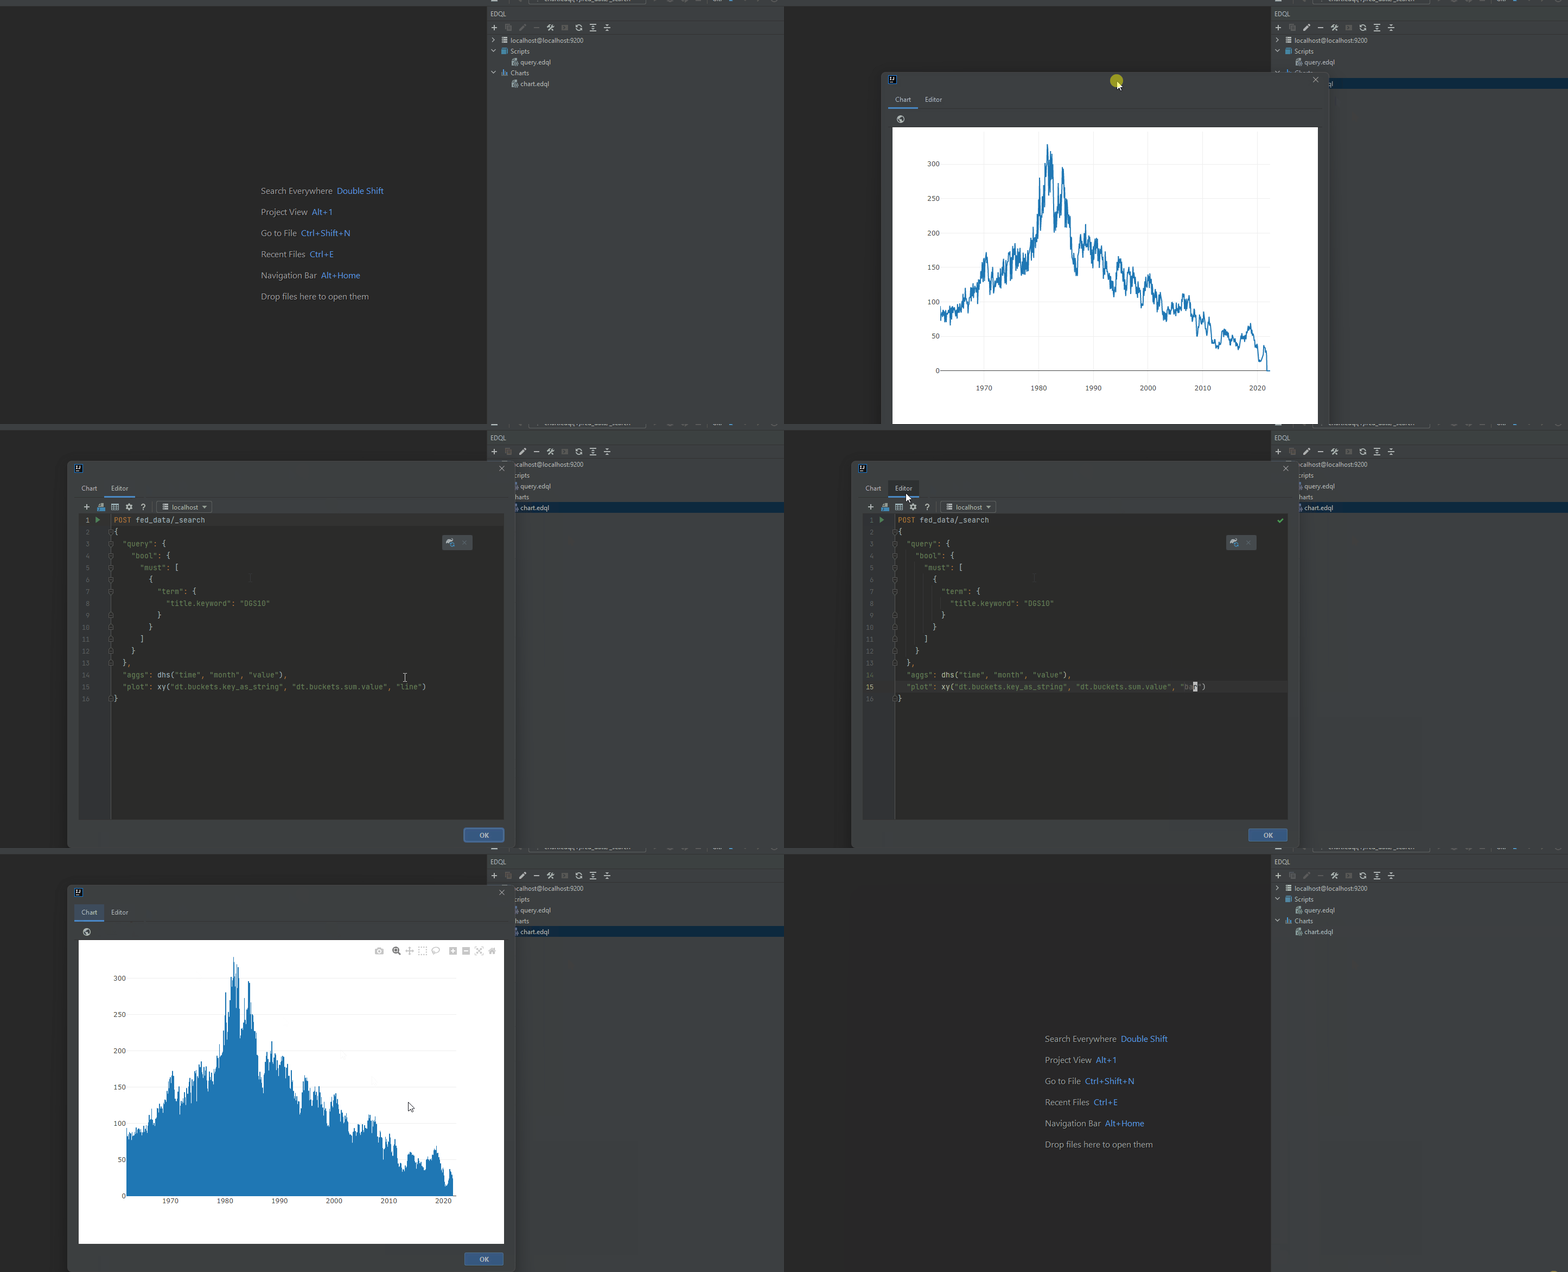
In plot mode, user can plot by using vega-lite syntax to plot Elasticsearch response.
#
Plot Aggregation
- plot metric
- plot date histogram
- plot stats
- multi line plot
